
SAT Access & Equity
More than ever, the population of students taking the SAT reflects the diverse makeup of America's classrooms.
Among SAT takers in the class of 2012:
- 45 percent were minority students (up from 44 percent in the class of 2011 and 38 percent in the class of 2008) making this the most diverse class of SAT takers ever.
- Among public school SAT takers in the class of 2012, 46 percent were minority students, up from 39 percent five years ago.
- 28 percent reported that English was not exclusively their first language (up from 27 percent in the class of 2011 and 24 percent in the class of 2008).
- Among public school SAT takers in the class of 2012, 25 percent reported that English was not exclusively their first language, up from 23 percent five years ago.
- 36 percent of all students reported their parents' highest level of education as a high school diploma or less.
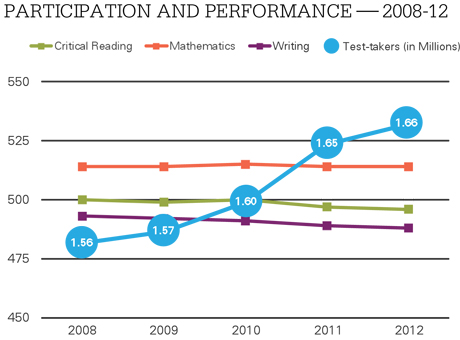
SAT Participation and Performance: Class of 2012
More than 1.66 million students took the SAT in the class of 2012, making it the largest class of SAT takers in history. The mean scores for the SAT class of 2012 were 496 in critical reading, 514 in mathematics and 488 in writing. Since 2008, SAT participation has increased 6 percent, while critical reading scores have declined four points, writing scores have declined five points, and mathematics scores have remained stable.
High School Course Work and SAT Performance
Academic preparedness for college is in large part dependent on the type and rigor of courses that students take in high school. Students in the class of 2012 who reported completing a core curriculum performed better on the SAT than those who did not complete a core curriculum.

More SAT Participation and Performance Data
Total Group Report and State Profile Reports: Total Group and state-level reports containing information about all SAT and SAT Subject Test™ takers from 1996–present are available on the College Board's Research & Development web site.
Comparing SAT Data:
Aggregate SAT data must always be considered in the context of other conditions that affect the educational system. Useful comparisons of students' performance are possible only if all students take the same test. It is not appropriate to rank or rate teachers, educational institutions, districts or states solely on the basis of aggregate scores derived from tests that are intended primarily as an individual measure.
No comment for "SAT Minority Participation Up"
Post a Comment